
REALIZATION OF THE SYSTEM FOR DYNAMIC RANGE CONTROL
CONTENTS
Dynamics of a signal Dynamic range control Static curve Level measurement
Gain factor smoothing Combination system
The dynamics of a signal means difference between the most silent and the loudest sounds in the whole composition or in another sound record. Human ear can distinguish the dynamics in the range of 140 dB. In this case the most silent sound is the threshold of hearing (0 dB) and the loudest is the threshold of pain (140 dB).
When any sound is processed, the dynamics is being determined by the dynamic range of the system. This means the low limit is given by the signal to noise distance, and the high limit is given by the maximal level of the signal, what the system can process.
Dynamic range control of audio signals is used in many applications to match the dynamic behavior of the audio signal to different requirements. While recording, dynamic range control protects the AD converter from overload or it is used in the signal path to optimally use the full amplitude range of a recording system. For suppressing low-level noise, so-called noise gates are used so that the audio signal is passed through only from a certain level onwards. While reproducing music and speech in a car, the dynamics have to match the special noise characteristic inside a car.
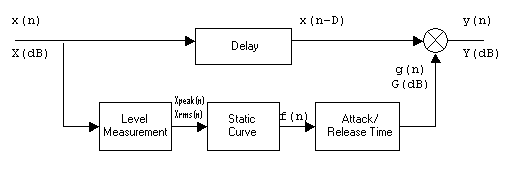
Figure 1. System for dynamic range control
Figure 1 shows a block diagram of system for dynamic range control. After measuring the input level X[dB], the output level Y[dB] is affected by multiplying the delayed input signal x(n) by a factor g(n) according to
y(n) = g(n) . x(n-D).
The delay of the signal x(n) compared with the control signal g(n) allows predictive control of the output signal level. This multiplicative weighting is carried out with corresponding attack and release time. Multiplication leads, in terms of a logarithmic representation, to the addition of the weighting level G[dB] to the input level X[dB] giving the output level Y[dB].
The relationship between input level and weighting level is defined by a static level curve G[dB] = f(X[dB]). An example of such static curve is given in Fig.2. Here, the output level and the weighting level are given as functions of the input level.
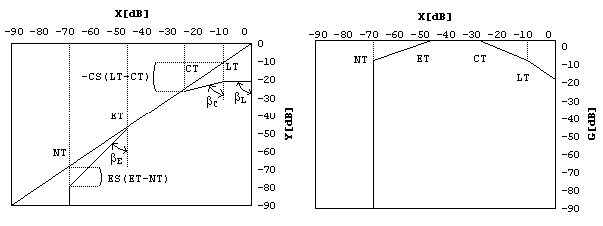
Figure 2. Static curve with the parameters LT=Limiter threshold, CT=Compressor threshold, ET=Expander threshold and NT=Noise gate threshold.
With the help of a limiter, the output level is limited when the input level exceeds the limiter threshold LT. All input levels above this threshold lead to a constant output level. The compressor maps a change of input level on a certain smaller changes of output level. In contrast to a limiter, the compressor increases the loudness of the audio signal. The expander increases changes in the input level to a larger changes in the output level. With this, an increase of the dynamics for low level is achieved. The noise gate is used to suppress low-level signals, for noise reduction and is also used for sound effects like truncating the decay of room reverberation. Every threshold used in particular parts of the static curve is defined as the lower limit for limiter and compressor and upper limit for expander and noise gate.
In the logarithmic representation of the static curve the compression factor R (Ratio) is defined by the ratio of the input level change D PI to the output level change D PO as given by R = D PI / D PO
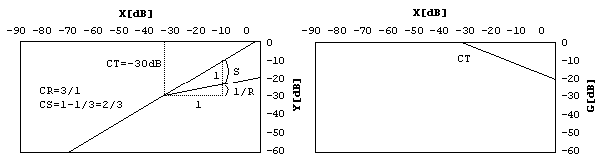
Figure 3. Compressor curve (Compressor ratio CR / slope CS)
With the help of Fig.3 the straight line equation Y = CT + 1/R . (X - CT) and the compression factor R = (X – CT) / (Y – CT) = tan b C are obtained, where the angle b is defined as shown in Fig.2. The relationship between the ratio R and the slope S can also be derived from Fig.3 and is expressed as
S = 1 – 1/R
R = 1/(1 - S)
Typical compression factors are
R = ¥ limiter
R > 1 compressor
0 < R < 1 expander
R = 0 noise gate.
Besides the static curve of dynamic the behavior in terms of attack and release times plays a significant role in sound quality. The rapidity of dynamic range control depends also on the measurement of PEAK and RMS values. For PEAK measurement, the absolute value of the input is compared with the peak value xpeak(n). If the absolute value is greater than the peak value, the difference is weighted with the coefficient AT (attack time) and added to (1 – RT). xpeak(n) (RT = release time). If the absolute value of the input is smaller than the peak value, the new peak value is equal to (1 – RT). xpeak(n). The difference equation is given by
xpeak(n) = (1 – AT – RT) . xpeak(n-1) + AT.|x(n)|.
The RMS measurement uses the square of the input and performs averaging with a first-order low-pass filter. The averaging coefficient TAV can have values equal to AT or RT. The difference equation is given by
xrms(n) = (1 – TAV). xrms(n-1) + TAV . x2(n).
The attack coefficient AT or release coefficient RT is obtained by comparing the input control factor and the previous one, as shown in Fig.4. A small hysteresis curve determines whether the control factor is in the attack or release status and hence gives the coefficient AT or RT. The system also serves to smooth the control signal. The difference equation is given by
g(n) = (1 – k) . g(n-1) + k . f(n),
with k = AT or k = RT.
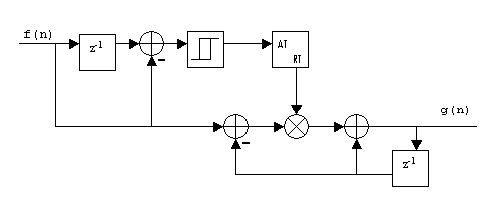
Figure 4. Implementing attack and release time or gain factor smoothing.
A combination of a limiter that uses PEAK measurement, and a compressor/expander/noise gate that is based on RMS measurement, is presented in Fig.5. The PEAK and RMS values are measured simultaneously. If the linear threshold of the limiter is crossed, the logarithm of the peak signal xpeak(n) is taken and the upper path, of the limiter is used for calculating the characteristic curve. If the limiter threshold is not crossed, the logarithm of the RMS value is taken and one of the three lower paths is used. The additive terms in the limiter and noise gate paths result from the static curve. After going through the range detector, the antilogarithm is taken. The sequence f(n) is smoothed with a SMOOTH filter in the limiter case, or weighted with corresponding attack and release times of the relevant operating range (compressor, expander or noise gate). In order to reduce the computational complexity, downsampling can be carried out after calculating the PEAK/RMS value. As the signals xpeak(n) and xrms(n) are already band-limited, they can be directly downsampled by taking every second or fourth value of the sequence. This downsampled signal is then processed by taking its logarithm, calculating the static curve, taking the antilogarithm and filtering with corresponding attack and release time with reduced sampling rate. The following upsampling by a factor of 4 is achieved by repeating the output value four times. This procedure is equivalent to upsampling by a factor 4 followed by a sample-and-hold transfer function.
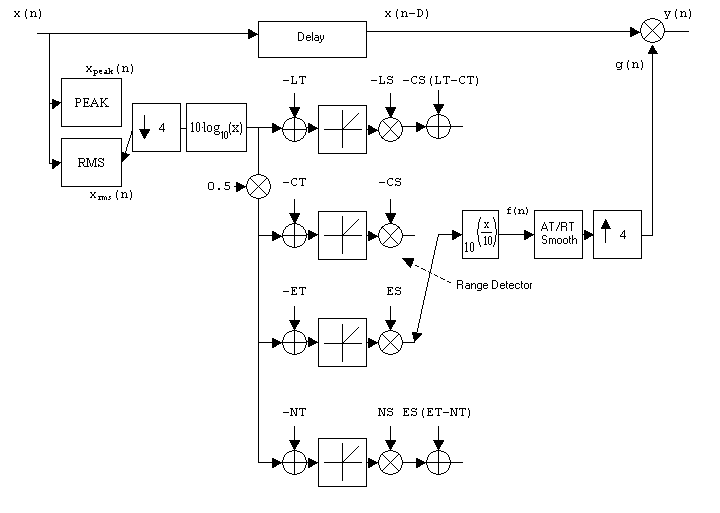
Figure 5. Dynamic system with sampling rate reduction.