
INFLUENCE OF VARIOUS PARAMETERS TO THE OUTPUT SIGNAL
It is very important to choose correct parameters that influence the behavior of the dynamics of the signal. In most cases, correct parameters can be chosen just by setting the basic values and these values must be tuned by trying and hearing the sound.
We will show on several examples, how the values of parameters influence the output signal, measure of peaks and RMSs and measure of control gain. All types of following examples are 16-bit mono with sampling rate 44100 Hz.

Examples:
Example 1: Progress of amplitudes of the input signal is as follows:
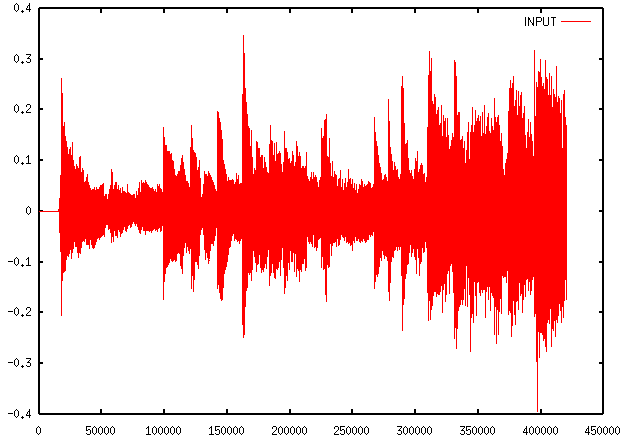
Figure 1. Progress of the input signal.
Fig.2 shows the output signal with alternated dynamics. To change the dynamics of the input signal following parameters were used:
| D | SRR | AT | RT | TAV | NT | ET | CT | LT | NR | ER | CR | LR | GF | hyst |
| 10 | 1 | 0.1 | 0.1 | 0.1 | -60 | -35 | -25 | -10 | 0.1 | 0.4 | 4 | 10 | 6 | 0.01 |

Figure 2. Progress of the output signal.
The dynamics of the input signal was changed. Expansion of the output signal has been smaller that expansion of the input signal because the gain factor was just GF = 6 dB, so the expansion of amplitudes has diminished. It was caused by the compressor and expander ratios that change almost the whole signal.

Example 2: If the AT value is changed to 0.8, this will affect peaks and control gain. This same will happen if the RT value is changed to 0.8.
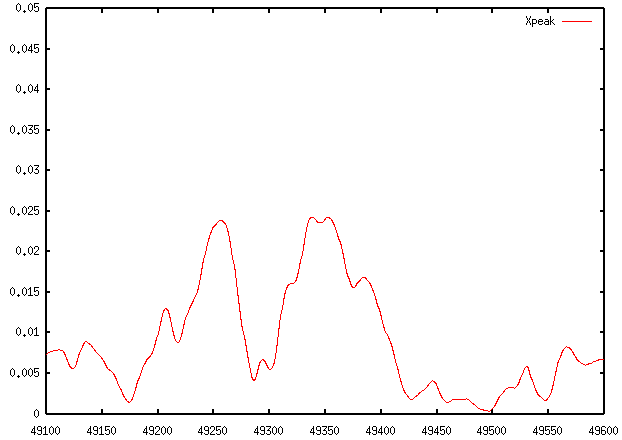
Figure 3. Progress of peak values from Example 1.
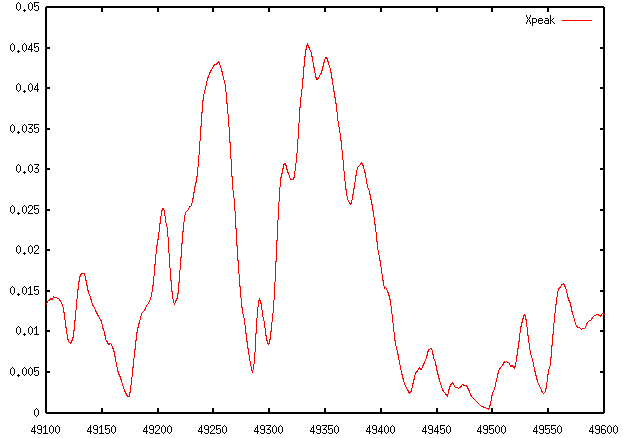
Figure 4. Progress of peak values with AT changed to 0.8.
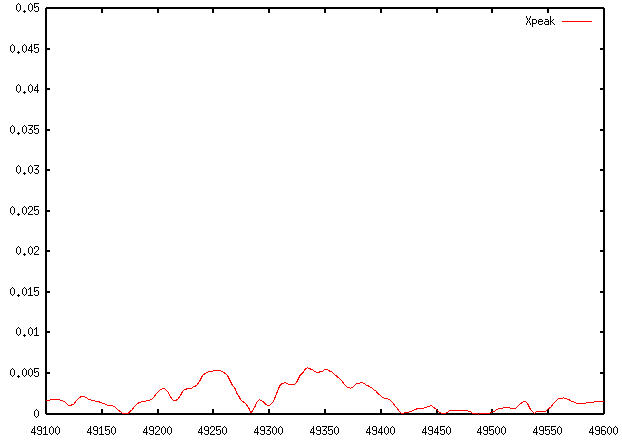
Figure 5. Progress of peak values with RT changed to 0.8.
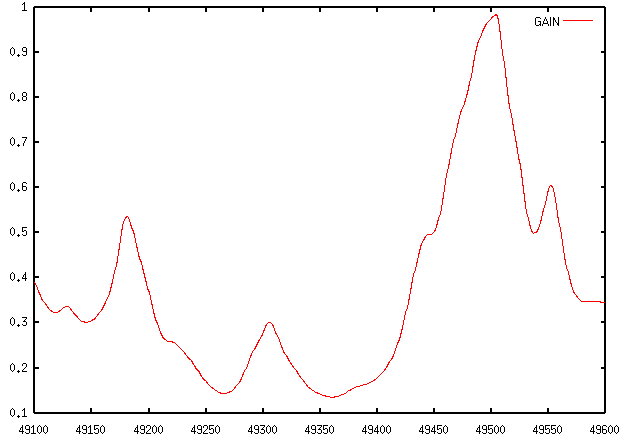
Figure 6. Progress of control gain from Example 1.
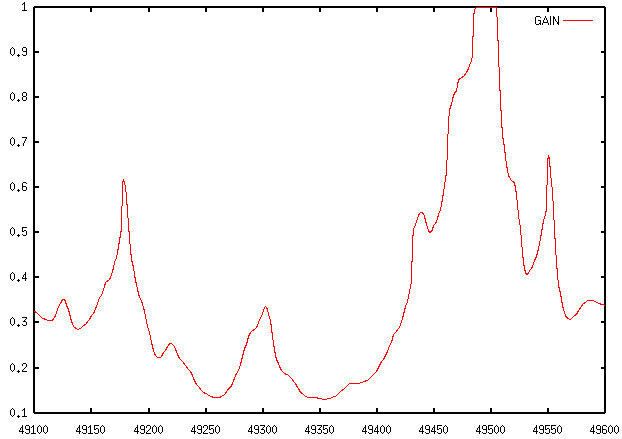
Figure 7. Progress of control gain with AT changed to 0.8.
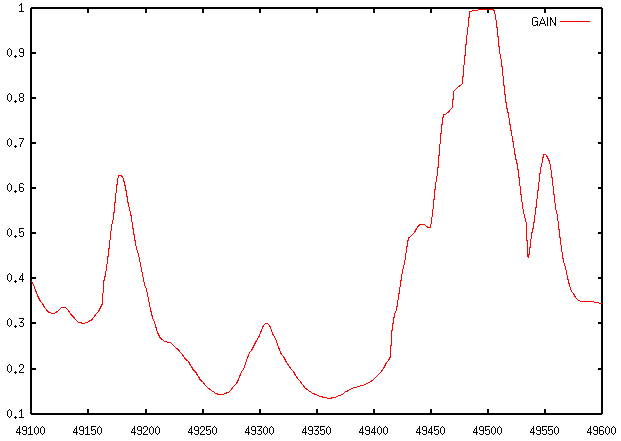
Figure 8. Progress of control gain with RT changed to 0.8.
Changing the peak values influences when is the signal in limiting or other phase (compression, no change, expansion, noise gate).

Example 3: If the TAV value is changed to 0.4, the measure of the RMSs will be affected and in this case control gain will be changed, too.
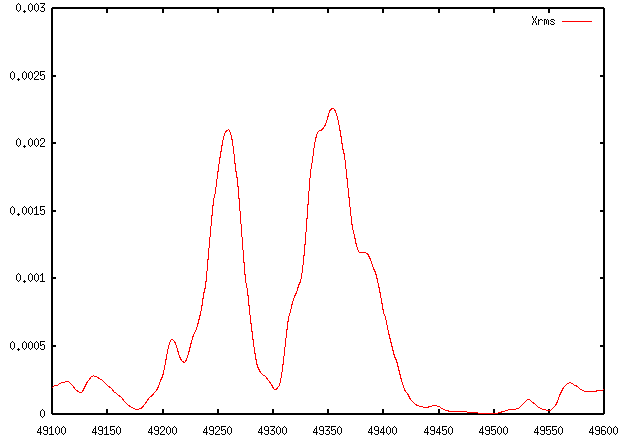
Figure 9. Progress of RMS values form Example 1.
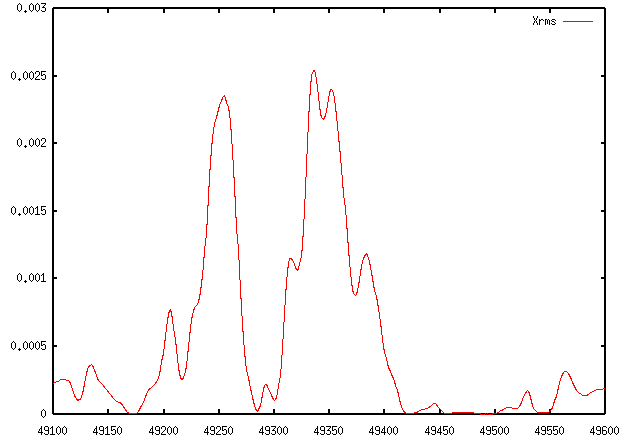
Figure 10. Progress of RMS values with TAV changed to 0.4.

Figure 11. Progress of control gain from Example 1.
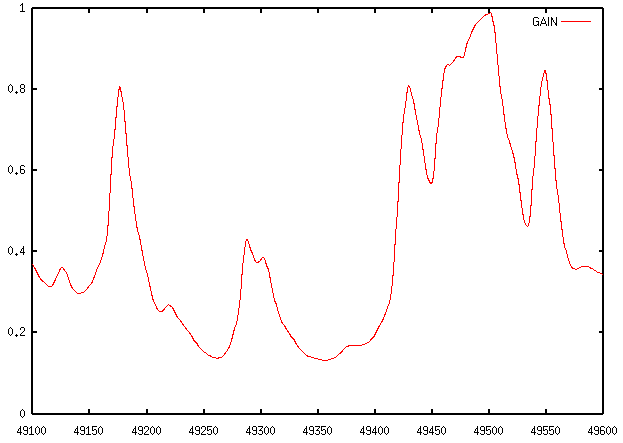
Figure 12. Progress of control gain with TAV changed to 0.4.

Example 4: If the expander ratio value is changed to 0.8, the control gain will be affected, and the output signal, too. The output signal with ER value set to 0.4 will have smaller dynamic changes than with ER set to 0.8.
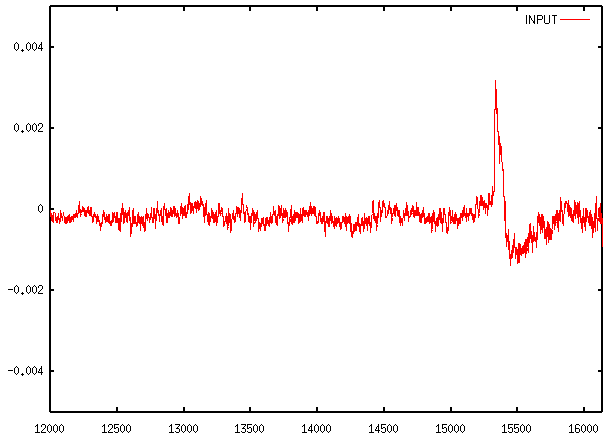
Figure 13. Progress of the input signal.
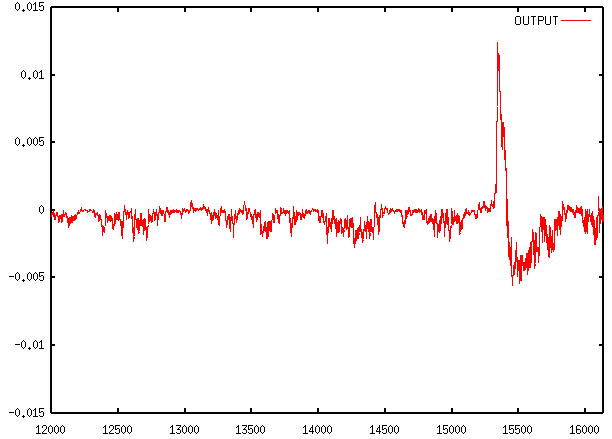
Figure 14. Progress of the output signal from Example 1.
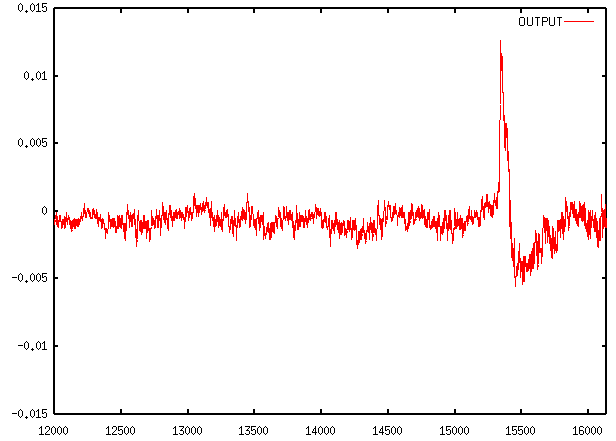
Figure 15. Progress of the output signal with ER changed to 0.8.

Example 5: If the compressor ratio value is changed to 8, the control gain and output signal will be changed. With compressor ratio set to 8 compression of the signal is better than with compression ratio set to 4. Because CR = 8 is big value, there will be small changes in the amplitude.
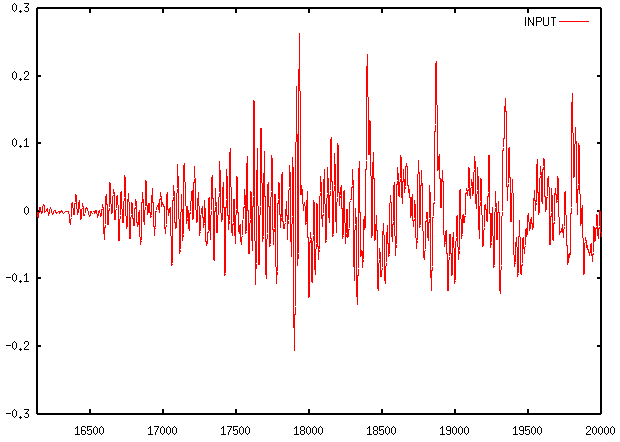
Figure 16. Progress of the input signal.
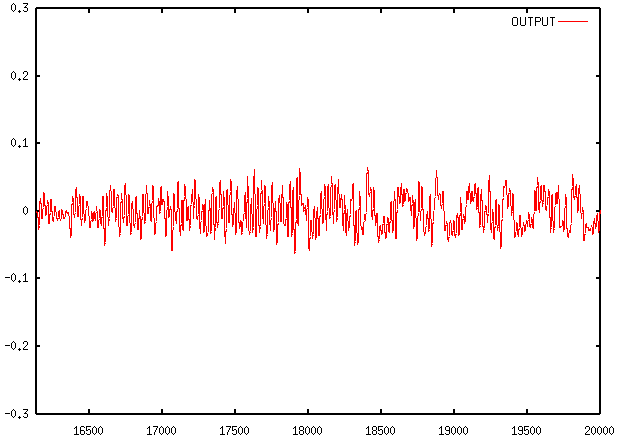
Figure 17. Progress of the output signal from Example 1.
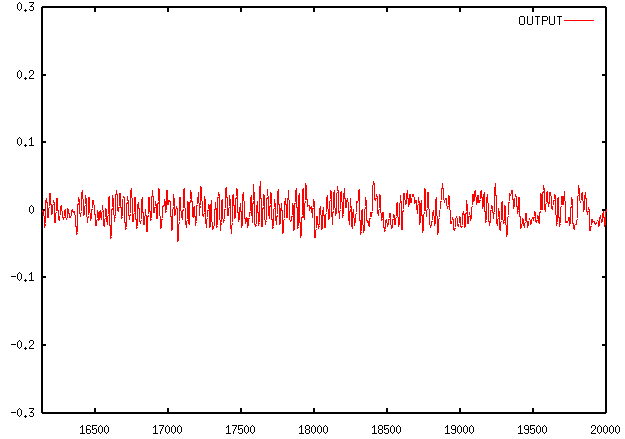
Figure 18. Progress of the output signal with CR changed to 8.

Example 6: If parameter SRR (sampling rate reduction) is changed to 4 (every fourth sample is taken), the control gain will be calculated for every fourth sample and will not alternate the next three samples. Group of four following samples of the output signal will not be same, because the control gain multiplies the delayed (not downsampled) input signal.

Figure 19. Progress of control gain from Example 1.
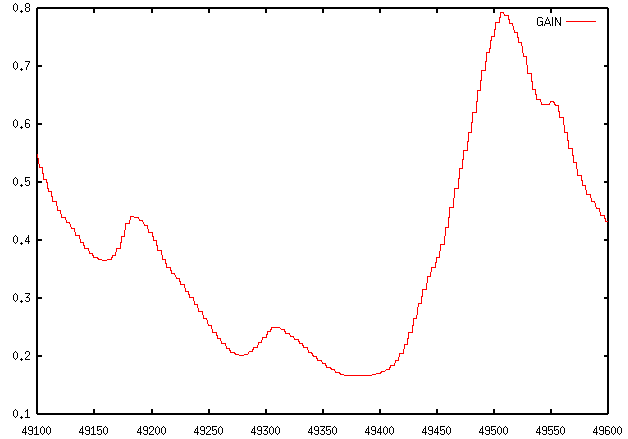
Figure 20. Progress of control gain with SRR set to 4.